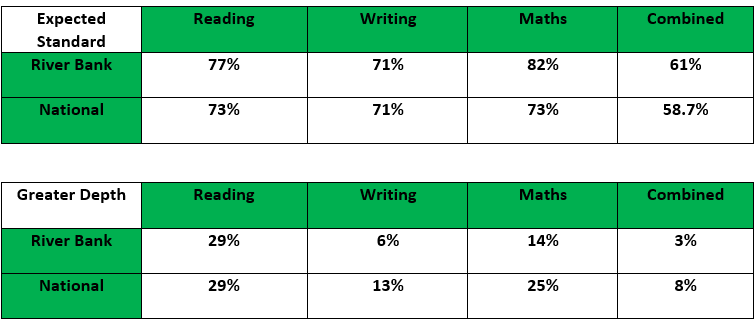
School Performance Data
Performance data for 2021/22.
Please note that performance data for 2022 should not be directly compared with 2019 and earlier. Nor should comparisons be made between schools. This is because schools may have been affected differently by COVID-19.
EYFS
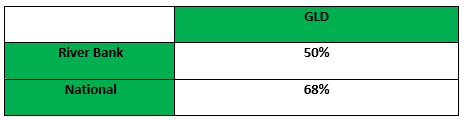
% of children reaching Good Level of Development (GLD) at the end of EYFS
|
GLD |
River Bank |
50% |
National |
65.2% |
Phonics
|
Year 1 |
by end of Year 2 |
River Bank |
89% |
92% |
National |
75% |
87% |
Key Stage 1
Expected standard |
Reading |
Writing |
Maths |
River Bank |
51% |
42% |
47% |
National |
66.9% |
57.6% |
67.7% |
Greater depth |
Reading |
Writing |
Maths |
River Bank |
7% |
3% |
7% |
National |
18% |
8% |
15.1% |
Year 4 Multiplication tables check (MTC)
|
25/25 |
Average score |
River Bank |
59.3% |
23/25 |
National |
27% |
19.8/25 |
Key Stage 2
Expected standard |
Reading |
Writing |
Maths |
Combined |
River Bank |
79% |
67% |
85.2% |
63% |
National |
75% |
69.5% |
71.4% |
58.7% |
Greater depth |
Reading |
Writing |
Maths |
Combined |
River Bank |
32.1% |
1.9% |
28.7% |
0.9% |
National |
27.8% |
12.8% |
22.4% |
7.2% |